Testing your code’s collaborators is really important but how do you test functions like UIImage(named:) or NSLocalizedString(_:tableName:bundle:value:comment:)?
#What are we testing?
We are not interested in testing whether methods like UIImage(named:) actually work as that’s Apple’s job but we should verify that we invoke the functions with the correct arguments.
The above is a simple call to UIImage(named:) with some simple logic to build the image name based on the passed index. The thing that we need to test here is the image name construction logic - we would like our tests to verify that if we call the function with the input of 1 that it will invoke UIImage(named: "jump_001").
#Dependency Injection to the rescue
To create a seam that allows testing the collaborator we can make UIImage(named:) injectable. Our production code can continue to use UIImage(named:) but our tests can use a different function that allows us to capture and verify the input.
####Start by making it injectable with a sensible default
The fact that functions are a first-class type in Swift means that it is super simple to use dependency injection to enable testing of functions. It’s always important to test our code’s collaborators to ensure that we are calling their contracts correctly and with the arguments that we expect to send.
Videos are a great way to consume information but they can sometimes drag their feet when it comes to getting to the important subject matter. When reading a blog or a book you can just skim read over the things you already know but this is difficult with video. I generally watch most programming podcasts/tutorials or conference talks at 2x and then just slow down when I need to take more time to digest the content.
##Native video
I use iTunes to subscribe to a few great podcasts like RubyTapas, NSScreencasts etc. The content is often great but the podcasts are aimed at a broad audience and so some things I can happily skim over. I don’t know if there is a better podcast player I should be looking at but I generally just open the podcast in QuickTime which allows my 2x playback.
##Youtube
There is too much great content to call out but Confreaks is one of my favorite channels for interesting talks. To get 2x playback speed on Youtube you need to ensure that you are using the HTML player.
The other obvious benefit to watching things at 2x speed is that they take half the time to watch. This is awesome especially if you are following series like Handmade Hero where the videos can easily be between 1-2 hours. It may not be possible to watch a whole video at 2x when it is dense with information but at least you can budget your time more wisely by skimming the less important details.
In most projects you’ll reach a point where you want to run slightly different code depending on the type of build configuration you are using. You may want to only use logging in DEBUG or potentially use different API keys for services between ad hocs and store builds. The process of doing this is fairly straight forward and uninteresting but I’m just going to point out how the pieces fit together and a couple of ways to test your setup to give you the confidence that the correct code will go to the app store and you don’t end up with egg on your face.
Let’s say we want to remove all occurrences of NSLog() in our project for any build configuration that is not DEBUG - simple enough.
So the first line #ifndef DEBUG is a compiler directive to check to ensure that the token DEBUG has not been defined in this file or any included files. If DEBUG has been defined then it removes the next two lines before compilation. If DEBUG has not been defined then these lines will be compiled and have the effect of replacing all calls to NSLog() with nothing. If we want to check that a token has been defined we use the similar looking #ifdef.
So hopefully the above was nothing new or interesting but you may be wondering where and why would DEBUG be defined as I don’t do it manually?
###Where’s my define?
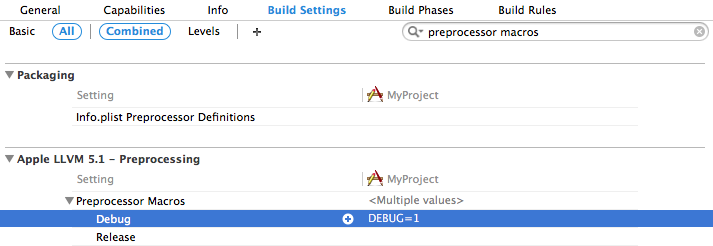
This is where the Xcode templates help us out a little. Jump to the build settings of a project and search for ‘preprocessor macros’ and you’ll see something like this:
As you can see from the above screenshot the Xcode default project settings have the define DEBUG=1 declared but only for the debug configuration.
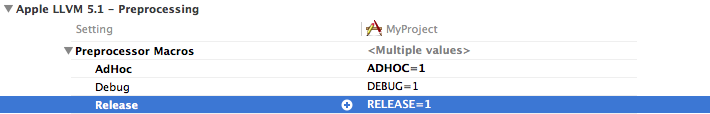
There is nothing special about how this is done that prevents you from adding your own defines. For example you may want to augment this so you can check other configurations. In the screenshot below I add RELEASE=1 for release builds and ADHOC=1 for a new configuration made for ad hocs.
###Location, location, location
So were would you put some code to remove NSLog()? It needs to be available everywhere to ensure that it effects every NSLog. A common place could be to just slap it in the {Project}-Prefix.pch file. This file will have been automatically created for you when starting with one of the Xcode templates.
I used the term “just slap it in the {Project}-Prefix.pch” as this is the simplest way to get code included everywhere in your project, but it’s not pretty. If you have too much code that you want to use everywhere your .pch will start to look like a dumping ground and it’s probably time to move this stuff into a better named file and include that in the .pch. Yes I know this is just hiding the code in another file but it certainly seems like a good compromise of convenience and tidiness, the alternative being to #import your new file everywhere you want to use your new code.
####Slight detour
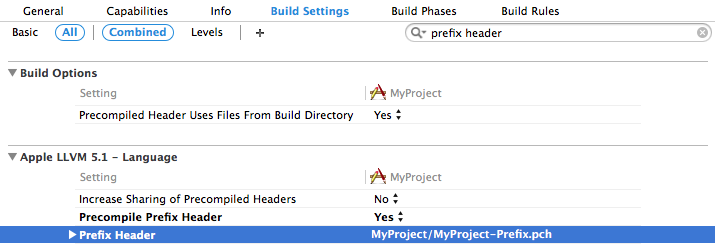
If you want to rename the .pch you have to also ensure that you update the build settings to reference the new name. The quickest way to find the setting is to use the filter on the build settings tab of the project and look for “prefix header”:
###Rocky waters
The .pch suffix actually stands for pre compiled header and it’s precompiled to speed up your build times. This means that Xcode can get a little bit moody if anything changes in any of the imported files - for that reason it’s best to only #import stable things (things that don’t change often) into the .pch. If you get into a situation where your project builds but Xcode spits out warnings related to the files that are #import‘d into your .pch you have to do a little dance to get Xcode working again.
I generally follow these steps - I build at each point and if the warnings go away you are done, if not keep going through the list
Do a full clean (⌘⌥⇧K)
Comment out the offending import, build, then uncomment the import, build
Do step 1 again and also delete derived data
Close Xcode
If you got here you are having a bad day :(
###Test
Great so you are using different build configurations to remove or add code but how do you get the confidence to know that you are not about to release the wrong code to the app store?
####Ad hoc
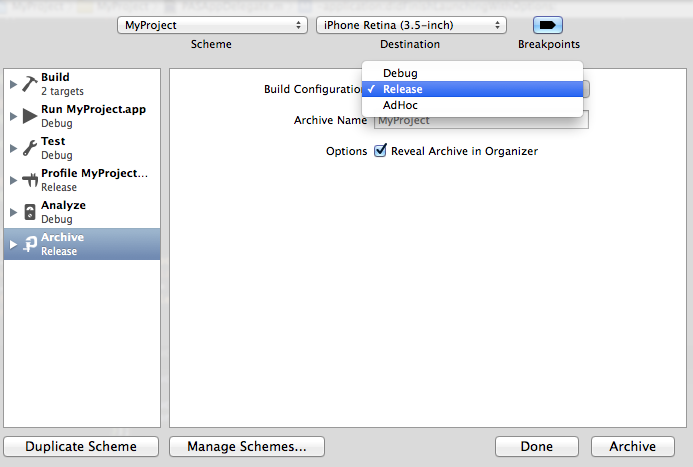
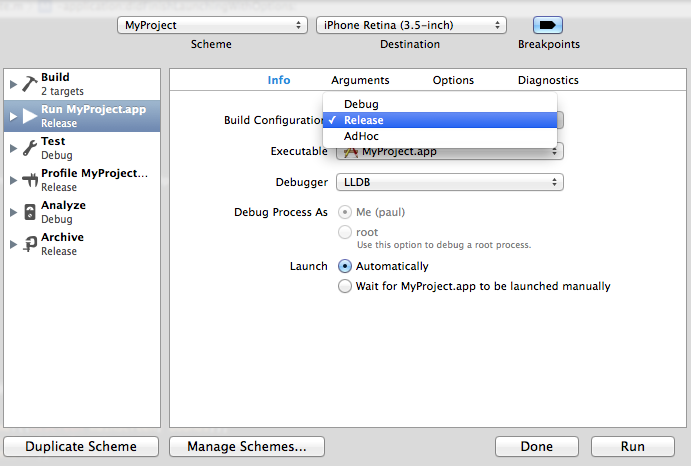
You should definitely without fail make an ad hoc using the configuration that you will use when going to store. To do this go to Product > Scheme > Edit Scheme (⌘<), switch to Archive and ensure that the Build Configuration is set to your app store configuration (most likely Release).
Now just test your app and make sure that it behaves as you expected.
####Preprocess
If you are like me and want to go full belts and braces you’ll want to see the code that will be run (seeing is believing). To do this edit the Run settings go to Product > Scheme > Edit Scheme (⌘<), switch to Run and ensure that the Build Configuration is set to your app store configuration (most likely Release).
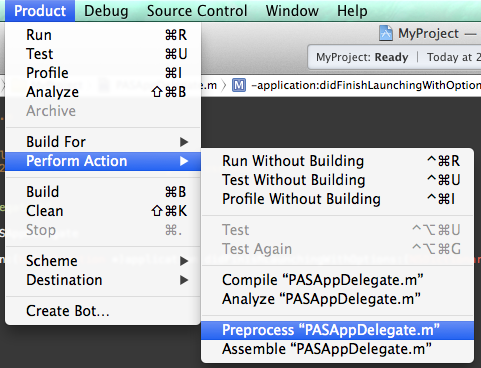
Now with the file that contains the conditional open go to Product > Perform Action > Preprocess "MyFile.m"
Xcode will make itself busy and then spit out the preprocessed file, which you can now search to ensure that the correct code was included/excluded. ProTip: your code will be way way way down the file, right near the bottom.
###Wrap up
I’m not going to lie this was not a very interesting post but it’s important to know how this stuff works to make sure that you are not accidentally including bad code in production builds.
Believe it or not there was a couple of useful/interesting things in the above post:
Looked at 2 build settings Preprocessor Macros and Prefix Header
Learn the Xcode dance when the .pch gets itself in knots
Test your code to be confident that the #ifdef’s are working as advertised
I think the ways of testing are the most important take away as it’s never a good idea to trust the code you just copied and pasted from StackOverflow. Your project may be configured differently and it would be foolish to trust a computer to “just work”.