Add name for debugging
06 Oct 2022A really useful trick when debugging is to subclass the thing you are interested in just to make it easier to search for inside the various debugging tools.
Worked example
I was hunting down a retain cycle using Xcode’s memory graph tool but although the tool is excellent the code I was debugging was not really set up to be useful.
In my example I had a CustomView (not its real name) that is used many times but I was only interested in one particular usage.
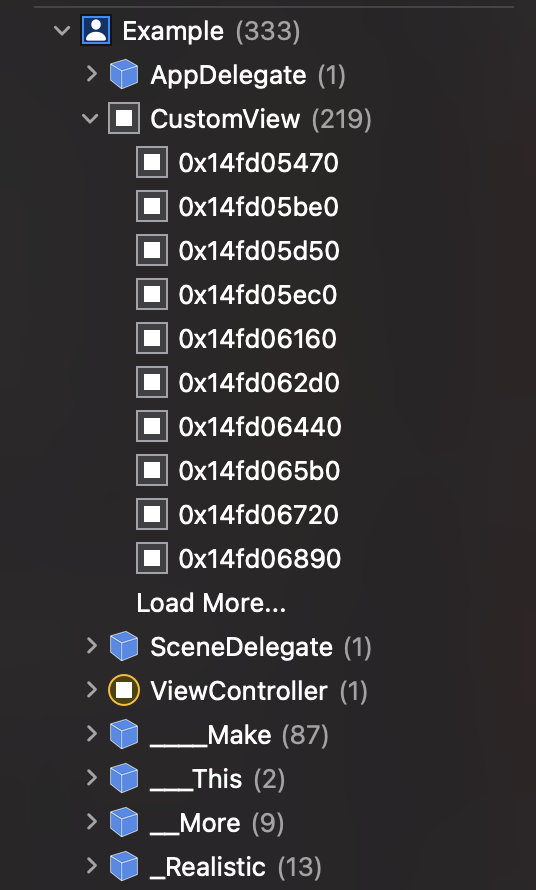
When spinning up the Debug memory graph tool I get presented with something like the below:

As you can see in the above for this run of the app I have 218 instances of CustomView, which means it will be a mighty task to try and locate the correct one before I can conduct my analysis.
Keep in mind that debugging could take multiple runs so I’d have to repeat the process of finding my view each time before I can doing any real investigation.
To make things easier on myself if I know roughly the area of code that might be causing the issue I can create a subclass to help make this search easier e.g.
class SentinelView: CustomView {}
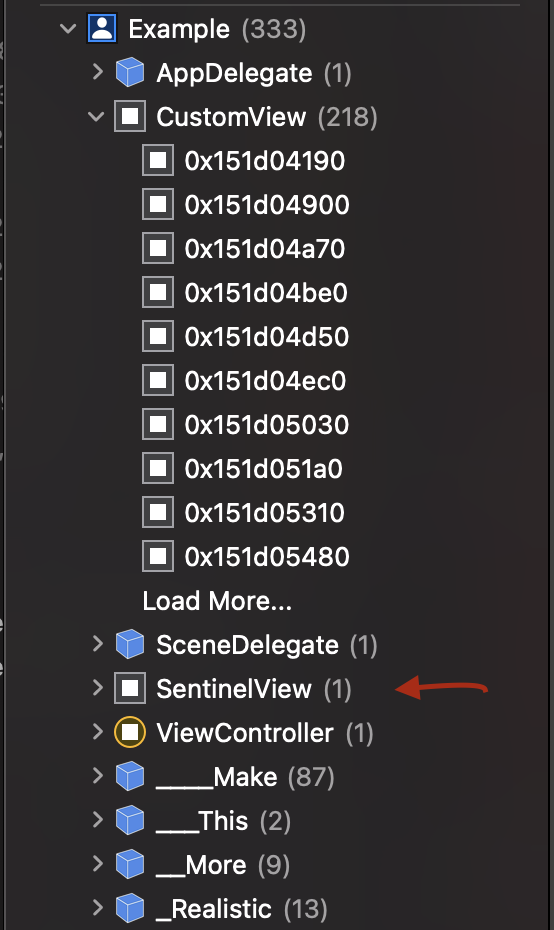
Now at the call site in question I instantiate my SentinelView instead of CustomView, everything behaves the same except when I open the memory graph tool this time my job is much simpler

Other uses
Here’s an example of printing the view hierarchies recursiveDescription

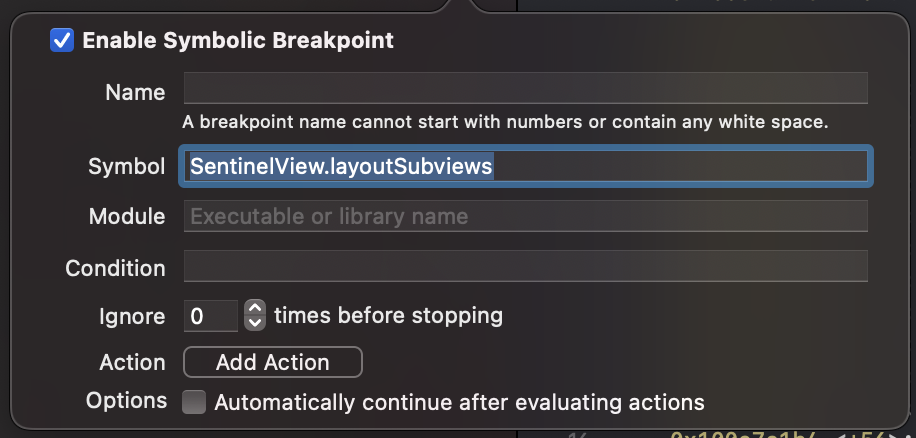
Here’s adding a symbolic breakpoint to this one type

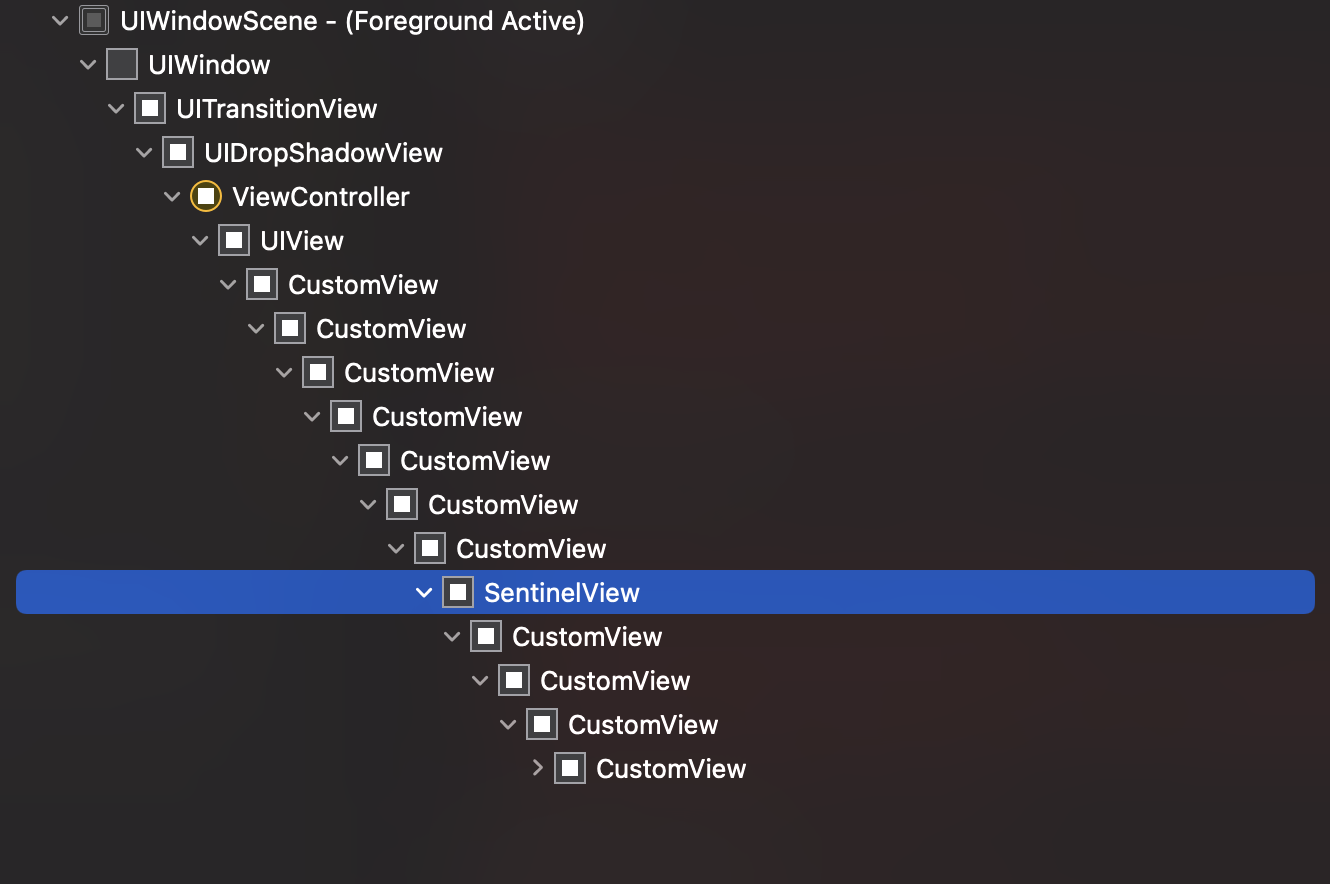
Here’s locating the view in the view hierarchy debugger

There are plenty more places like instruments, logging etc to make use of this technique.
Conclusion
This technique has been in my back pocket for many years and it’s always been really useful. For as long as we have tools that show information and log class names it’s always helpful to be able to help narrow the search.